Our Music App Report is the most comprehensive research available on the industry, with a wealth of detailed analysis. Within the report, you’ll find forecasts for market size, streaming revenues segmented by region, country-level market share, usage and download statistics, demographics, and benchmarking data.
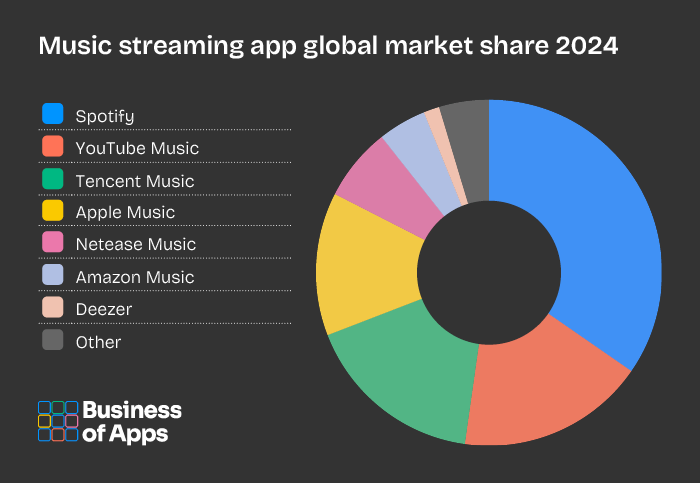
What music streaming app has the most market share?
In almost all countries Spotify is the market leader, with its freemium model able to attract more users than Apple Music and Amazon Music. In some countries Spotify has a double digit advantage, in the US, France and Germany its lead is smaller.
How much revenue do music streaming apps make?
Music streaming apps increased their revenues by 12.5% in 2024, generating over $50 billion. This accounted for about 80% of all recorded music revenues.
How much time does the average user spend listening to music?
The average time spent listening to music has increased over the past five years, surpassing 20 hours per week in 2020. Streaming services have increased the average time spent on their apps through the launch of podcasts and audiobooks.

Sector overview
Music streaming was born out of the need to find a legal way to stream music, as the piracy giants of the 2000s were being shut down by the US government for copyright infringement. Spotify, Deezer and Pandora, alongside a few others, launched apps that allowed users access to large libraries of music while also paying the artists.
It has been a strenuous relationship between these streaming services and artists, as the pay per stream from all of them is far lower than what artists received in the vinyl and CD era. To add to that, Spotify, Apple and others have seen their revenues grow faster than record labels and artists.
To add to that, a majority of music listeners don’t pay for music at all, instead listening to it through YouTube music videos, Spotify’s freemium service and other free music streaming apps.
Music streaming is the most popular way to listen to music and generates more revenue than physical music sales by a large margin. Spotify and others have also used their position as leaders in music streaming to launch other audio services, such as podcasts and audiobooks.

Table of contents
- Music App Financials
- Market Size
- Market Size Forecast
- Revenue by Region
- Revenue by Country
- Individual App Revenues
- Revenue by Format
- Music App Usage
- Total Users
- Individual App Users
- Average Usage
- Usage by Format
- Music App Subscribers
- Total Subscribers
- Subscribers Forecast
- Individual App Subscribers
- Music App Downloads
- Total Downloads
- Downloads by Region
- Individual App Downloads
- Music App Market Share
- Market Share US
- Market Share UK
- Market Share Germany
- Market Share France
- Market Share Latin America
- Other Format Market Share
- Music App Demographics
- Age Demographics
- Engagement by Age
- Spend by Age
- Individual App Demographics
- Music App Benchmarks
- Marketing Metrics
- Revenue Metrics
- Engagement Metrics
The Music App Report – Research, Insights and Statistics is provided as downloadable PDF document with all data presented as charts and tables. So you can easily extract graphics and individual data. It provides an overview of the sector’s financials, usage, downloads, market share, demographics, and benchmarks.


What’s included?
- Document: PDF
- Charts: 102
- Data Points: 1355
- Pages: 107
The Music App Report – Research, Insights and Statistics has been assembled by our in-house team of analysts at Business of Apps. We believe this is the most comprehensive report available on the music app market. If you have any questions get in touch data@businessofapps.com
What apps are covered in our report?
- Spotify
- Apple Music
- YouTube
- Amazon Music
- SoundCloud
- Pandora
- Deezer
- Tidal
- iHeart Radio
- TuneIn Radio
- Tencent Music
- NetEase Music
- JioSaavn
- Wynk Music
- Gaana Music
- Line Music

List of Charts
-
- Music Streaming Revenues
- Music Streaming Revenues Forecast
- Music Streaming Revenues in US
- Music Streaming Revenues by App
- Music Streaming Revenues by Region
- Spotify Revenues
- Spotify Revenue Mix
- YouTube Music Revenues
- Apple Music Revenues
- Amazon Music Revenues
- Amazon Music Revenues Mix
- Pandora Revenues
- Deezer Revenues
- Tidal Revenues
- SoundCloud Revenues
- iHeart Radio Revenues
- Tencent Music Revenues
- NetEase Music Revenues
- Line Music Revenues
- Music Streaming US Revenue by Format
- Music Revenue by Format
- Music Streaming Licensing Revenue Split
- Podcast Revenue
- Audiobook Revenue
- Music Streaming App Users
- YouTube Users
- Spotify Users
- SoundCloud Users
- Amazon Music Users
- Pandora Users
- Tencent Music Users
- NetEase Music Users
- India Music App Users
- Music Streaming Average Daily Usage
- Music Listening Average Time Spent
- Podcast Users
- Audiobook Usage
- Music Streaming Subscriptions
- Music Streaming Subscriptions Forecast
- Music Streaming Subscribers by App
- Spotify Subscribers
- Apple Music Subscribers
- Amazon Music Subscribers
- YouTube Music Subscribers
- Tencent Music Subscribers
- NetEase Music Subscribers
- Pandora Subscribers
- Music Streaming App Downloads
- Music Streaming Downloads by App
- Music Streaming Downloads by App in US
- Spotify Downloads
- YouTube Music Downloads
- Amazon Music Downloads
- Apple Music Downloads
- SoundCloud Downloads
- Deezer Downloads
- Pandora Downloads
- Tidal Downloads
- India Music App Downloads
- Line Music Downloads
- Radio App Downloads
- Music Streaming App Global Market Share
- Music Streaming App Market Share in US
- Music Streaming App Market Share in UK
- Music Streaming App Market Share in Germany
- Music Streaming App Market Share in France
- Music Streaming App Market Share in China
- Music Streaming App Market Share in Latin America
- Podcasting App Market Share in US
- Audiobook App Market Share
- Music Streaming Age Demographics
- Spotify Age Demographics
- Apple Music Age Demographics
- Amazon Music Age Demographics
- YouTube Music Age Demographics
- Music Streaming App Gender Demographics
- Music Streaming Engagement by Age
- Music Streaming Engagement by Country
- Podcast Engagement by Age
- Music Spend by Age
- Music App Retention Rate
- Music App Retention Rate by Platform
- Music App Subscription Retention Rate
- Music App Conversion Rate
- Music App Activation Rate
- Music App Reactivation Rate
- Music App Renewal Rate
- Music Streaming Subscription Costs
- Music Streaming Pay Per Stream
- Music Streaming Amount of Streams Per Dollar
- Music Listening vs Radio by Age
- Reasons for Churn With Music Apps
- Engagement With Music by Format Type
- Entertainment Usage by Activity
- Entertainment Usage by Activity 18 to 24 Year Olds
- Podcast Revenues by Ad Placement
- Podcast Revenues by Ad Type
- Audiobook Engagement by Activity

How does it work?
To get access to the Music App Report – Research, Insights and Statistics hit the buy now button above. After payment you will be taken to the download page to access your Music App Report – Research, Insights and Statistics PDF. If you need any help email data@businessofapps.com.
We have joined Treeapp, an incredible organization dedicated to reforesting the world. They will plant one tree for your data report purchase.
What our customers say about our reports

“Your report gave us some very useful insights on app statistics. As we are starting to develop apps it’s crucial information”

“This report is great work, it helped us get a better understanding of revenue and growth to include it in our analysis for LatAm. It has been very useful.”

“We have found Business of Apps data to be most accurate and complete on the web.”

“All the metrics and KPIs I was looking for are in one document for a very good price. The report was exactly what I expected.”

"There was an abundance of excellent information in the report, well worth the money. There were areas which had information I haven't seen anywhere else."

"Money well spent as far as I am concerned. A clear, well-written report"

“What a great resource!”

"This data has been a huge help for us launching our dating app"