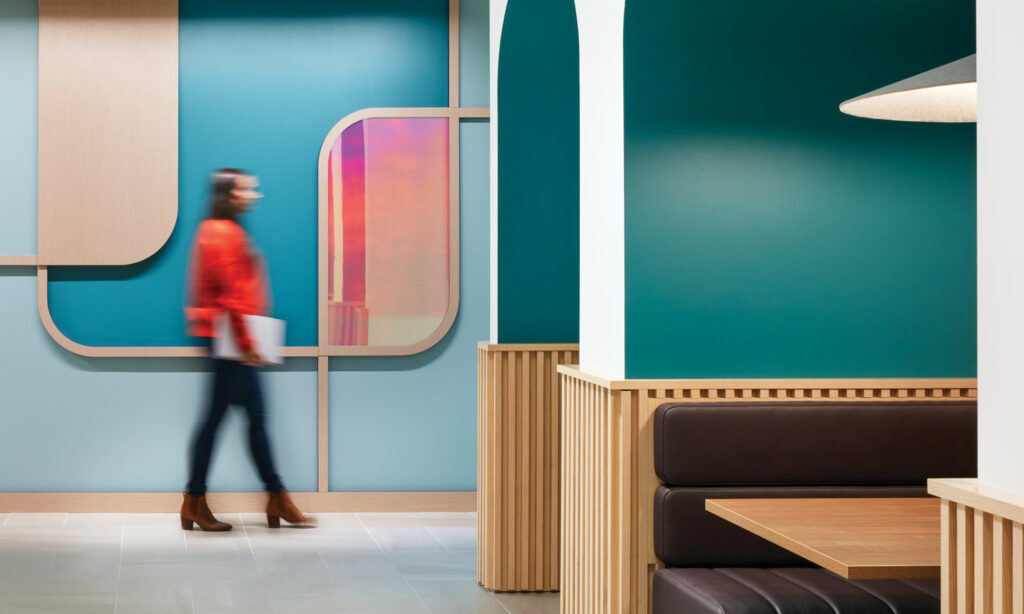

Unveiling Interior Design’s 2024 Hospitality Giants
2023 marked a year of very strong recovery for the Giants in general, with almost all metrics surpassing the 2019 levels: salaries, staffing, billing rates, fees. But when it comes to the sector-by-sector temperature-check, the landscape is more uneven. Hospitality joins corporate in the recovery-pending zone. Giants working in this vertical are still struggling to surpass pre-pandemic fees: They’re down 44 percent compared to 2019. In fact, hospitality is faring the worst of all sectors. Chalk it up to the expected revenge travel surge that never came to pass, and that business travel remains sluggish.
2024 Hospitality Giants Rankings
| wdt_ID | wdt_created_by | wdt_created_at | wdt_last_edited_by | wdt_last_edited_at | 2024 Rank | Firm | Headquarters | Design Fees (in millions) | FFC Value of Work Installed (in millions) | Design Staff | 2023 Rank |
|---|---|---|---|---|---|---|---|---|---|---|---|
| 1 | michelleyee | 13/05/2024 04:25 PM | michelleyee | 13/05/2024 04:25 PM | 1 | HBA INTERNATIONAL | Santa Monica | 100.4 | 6,026.8 | 1,181 | 1 |
| 2 | michelleyee | 13/05/2024 04:25 PM | michelleyee | 13/05/2024 04:25 PM | 2 | GENSLER | San Francisco | 42.4 | 3,176 | 3 | |
| 3 | michelleyee | 13/05/2024 04:25 PM | michelleyee | 13/05/2024 04:25 PM | 3 | ROCKWELL GROUP | New York | 34.5 | 295 | 2 | |
| 4 | michelleyee | 13/05/2024 04:25 PM | michelleyee | 13/05/2024 04:25 PM | 4 | HKS | Dallas | 33.5 | 174 | 12 | |
| 5 | michelleyee | 13/05/2024 04:25 PM | michelleyee | 13/05/2024 04:25 PM | 5 | WIMBERLY INTERIORS | New York | 22.6 | 79 | 4 | |
| 6 | michelleyee | 13/05/2024 04:25 PM | michelleyee | 13/05/2024 04:25 PM | 6 | FORRESTPERKINS/PERKINS EASTMAN | New York | 20.3 | 305 | 5 | |
| 7 | michelleyee | 13/05/2024 04:25 PM | michelleyee | 13/05/2024 04:25 PM | 7 | AVROKO | New York | 20.2 | 2.4 | 120 | 7 |
| 8 | michelleyee | 13/05/2024 04:25 PM | michelleyee | 13/05/2024 04:25 PM | 8 | DLR GROUP | Minneapolis | 17.3 | 4.0 | 870 | 10 |
| 9 | michelleyee | 13/05/2024 04:25 PM | michelleyee | 13/05/2024 04:25 PM | 9 | BASKERVILL | Richmond | 16.6 | 158.9 | 79 | 14 |
| 10 | michelleyee | 13/05/2024 04:25 PM | michelleyee | 13/05/2024 04:25 PM | 10 | ICRAVE, A JOURNEY COMPANY | New York | 15.5 | 395.1 | 60 | 17 |
“blank cells” = did not report data
But looking more closely at individual data points, hospitality fee income did increase 12 percent year-over-year, and Giants are predicting another small 5 percent bump-up for 2024. So, the needle is moving in the right direction. Moreover, these are quite high fees: $645.6 million in 2023 (versus $576.2 in 2022)! To put things in better perspective, the verticals experiencing double-digit growth—including government/civic and transportation—make up a much, much smaller piece of the Giants pie in comparison. It stands to follow that hospitality has a comparatively bigger dollar-amount gap to recover.
Typical for this sector, the greatest growth is happening in luxury hotels, comprising almost a quarter of fees, with restaurants in second, resorts in third, and boutique hotels in fourth— together driving some serious dollars. Many other segments, including cruise ships, remain flat, however. Segment predictions for 2024 are dead-even with 2023 actuals, with a majority expecting the most growth in luxury hotels.
Project totals are also way up, to the tune of 40 percent year-over-year and 63 percent higher than 2019. The hard numbers are fantastic: almost 8,000 projects, a figure that doubled over the last decade. And Giants are expecting another 11 percent project growth for 2024, which would bring the amount very close to 9k.
You may be scratching your head thinking something doesn’t track: How can hospitality projects balloon so much over the last five years—but fees overall remain down from 2019? A likely explanation is that Giants are working on smaller projects for less dollars, and/or more renovation projects versus new construction. This would be in line with anecdotal reporting. Interestingly, FF&C value also increased robustly between 2022 and 2023: from $14.7 to $22.4 billion. That’s 53 percent year-over- year and surpassing the 2019 numbers by 15 percent. Again, these big digits to some extent reflect the inflating cost of products and construction. But Giants expect a strong 22 percent growth curve for 2024, which implies an upward trend that’s independent of hard costs. (The FF/C ratio has been consistent over the last decade but is currently trending higher towards furniture and fixtures.)
In terms of locations, Hospitality Giants tend to have the highest percentage of overseas projects in comparison to other verticals. While most sectors hover around a 90/10 split between domestic and international, hospitality has traditionally held steady around 80/20, and this year is no different, albeit skewing toward domestic. Once again, the biggest growth markets are Asia, Canada, and Europe overseas and, in the U.S., the southernmost regions.
Firms With The Most Fee Growth (in millions)
| wdt_ID | wdt_created_by | wdt_created_at | wdt_last_edited_by | wdt_last_edited_at | Firm | 2022 Fees | 2023 Fees | Increase |
|---|---|---|---|---|---|---|---|---|
| 1 | michelleyee | 13/05/2024 06:48 PM | michelleyee | 13/05/2024 06:48 PM | HKS | 14.7 | 33.5 | 18.8 |
| 2 | michelleyee | 13/05/2024 06:48 PM | michelleyee | 13/05/2024 06:48 PM | Gensler | 24.9 | 42.4 | 17.5 |
| 3 | michelleyee | 13/05/2024 06:48 PM | michelleyee | 13/05/2024 06:48 PM | Jacobs | 4.8 | 14.2 | 9.4 |
| 4 | michelleyee | 13/05/2024 06:48 PM | michelleyee | 13/05/2024 06:48 PM | ICRAVE, a Journey Company | 9.9 | 15.5 | 5.6 |
| 5 | michelleyee | 13/05/2024 06:48 PM | michelleyee | 13/05/2024 06:48 PM | Elkus Manfredi Architects | 1.1 | 5.6 | 4.5 |
| 6 | michelleyee | 13/05/2024 06:48 PM | michelleyee | 13/05/2024 06:48 PM | Sargenti Architects | 3.7 | 8.0 | 4.3 |
| 7 | michelleyee | 13/05/2024 06:48 PM | michelleyee | 13/05/2024 06:48 PM | Champalimaud Design | 8.0 | 12.0 | 4.0 |
| 8 | michelleyee | 13/05/2024 06:48 PM | michelleyee | 13/05/2024 06:48 PM | //3877 | 2.8 | 6.3 | 3.5 |
| 9 | michelleyee | 13/05/2024 06:48 PM | michelleyee | 13/05/2024 06:48 PM | MKDA | 0.8 | 3.5 | 2.7 |
| 10 | michelleyee | 13/05/2024 06:48 PM | michelleyee | 13/05/2024 06:48 PM | Hord Coplan Macht | 2.6 | 5.2 | 2.6 |
Editor’s Note: Take a look at recent coverage of our Hospitality Giants most admired firms of 2024 below. Yabu Pushelberg tops the list followed by AvroKO, Rockwell Group, and Meyer Davis Studio.
Read More About Most Admired Firms

Projects
George Yabu and Glenn Pushelberg Design a Dramatic Hotel in Leicester Square
2021 Best of Year winner for Boutique Hotel. Plays staged in the West End have been entertaining theatergoers for over 350 years. As the scene rebounds from pandemic closures, visitors can enjoy that spectacle while stay…
Projects
AvroKO Turns to Warm Brutalism for the Jay Hotel
Warm brutalism may sound like a contradiction in terms, but it aptly describes the interiors of the 24-story, 360-key Jay hotel by AvroKO.
Projects
Rockwell Group Updates a Historic Hotel in Boca Raton
Rockwell Group renovates, expands, and coheres a 1926 hotel property in Palm Beach in the firm’s signature luxury and consideration of site.


Percentage of Firms Predicting Category Growth Over Next Two Years
| wdt_ID | wdt_created_by | wdt_created_at | wdt_last_edited_by | wdt_last_edited_at | Project Types | More Projects | No Change | Fewer Projects |
|---|---|---|---|---|---|---|---|---|
| 1 | michelleyee | 13/05/2024 07:45 PM | michelleyee | 13/05/2024 07:45 PM | Boutique hotels | 57 | 20 | 3 |
| 2 | michelleyee | 13/05/2024 07:45 PM | michelleyee | 13/05/2024 07:45 PM | Luxury hotels | 51 | 23 | 5 |
| 3 | michelleyee | 13/05/2024 07:45 PM | michelleyee | 13/05/2024 07:45 PM | Restaurants/bars | 51 | 30 | 4 |
| 4 | michelleyee | 13/05/2024 07:45 PM | michelleyee | 13/05/2024 07:45 PM | Resorts/spas/country clubs | 49 | 24 | 5 |
| 5 | michelleyee | 13/05/2024 07:45 PM | michelleyee | 13/05/2024 07:45 PM | Multiuse | 46 | 24 | 4 |
| 6 | michelleyee | 13/05/2024 07:45 PM | michelleyee | 13/05/2024 07:45 PM | Mid/economy hotels | 34 | 27 | 4 |
| 7 | michelleyee | 13/05/2024 07:45 PM | michelleyee | 13/05/2024 07:45 PM | Senior living | 28 | 44 | 0 |
| 8 | michelleyee | 13/05/2024 07:45 PM | michelleyee | 13/05/2024 07:45 PM | Condo-hotels/timeshares | 20 | 24 | 5 |
| 9 | michelleyee | 13/05/2024 07:45 PM | michelleyee | 13/05/2024 07:45 PM | Gaming | 18 | 23 | 5 |
| 10 | michelleyee | 13/05/2024 07:45 PM | michelleyee | 13/05/2024 07:45 PM | Micro-hotels | 11 | 31 | 5 |
| 11 | michelleyee | 13/05/2024 07:45 PM | michelleyee | 13/05/2024 07:45 PM | Cruise ships | 9 | 23 | 1 |
Percentage of Firms Projecting Regional Growth Over the Next Two Years
U.S.
| wdt_ID | wdt_created_by | wdt_created_at | wdt_last_edited_by | wdt_last_edited_at | Total U.S. | Percentage |
|---|---|---|---|---|---|---|
| 1 | michelleyee | 13/05/2024 10:54 PM | michelleyee | 13/05/2024 10:54 PM | Southeast | 70 |
| 2 | michelleyee | 13/05/2024 10:54 PM | michelleyee | 13/05/2024 10:54 PM | Southwest | 67 |
| 3 | michelleyee | 13/05/2024 10:54 PM | michelleyee | 13/05/2024 10:54 PM | Northeast | 53 |
| 4 | michelleyee | 13/05/2024 10:54 PM | michelleyee | 13/05/2024 10:54 PM | Midsouth | 49 |
| 5 | michelleyee | 13/05/2024 10:54 PM | michelleyee | 13/05/2024 10:54 PM | Mid-Atlantic | 33 |
| 6 | michelleyee | 13/05/2024 10:54 PM | michelleyee | 13/05/2024 10:54 PM | Midwest | 26 |
| 7 | michelleyee | 13/05/2024 10:54 PM | michelleyee | 13/05/2024 10:54 PM | Northwest | 25 |
International
| wdt_ID | wdt_created_by | wdt_created_at | wdt_last_edited_by | wdt_last_edited_at | International | Percentage |
|---|---|---|---|---|---|---|
| 1 | michelleyee | 13/05/2024 10:55 PM | michelleyee | 13/05/2024 10:55 PM | Middle East | 32 |
| 2 | michelleyee | 13/05/2024 10:55 PM | michelleyee | 13/05/2024 10:55 PM | Caribbean | 29 |
| 3 | michelleyee | 13/05/2024 10:55 PM | michelleyee | 13/05/2024 10:55 PM | Europe | 23 |
| 4 | michelleyee | 13/05/2024 10:55 PM | michelleyee | 13/05/2024 10:55 PM | Mexico | 21 |
| 5 | michelleyee | 13/05/2024 10:55 PM | michelleyee | 13/05/2024 10:55 PM | Central/South America | 15 |
| 6 | michelleyee | 13/05/2024 10:55 PM | michelleyee | 13/05/2024 10:55 PM | Canada | 8 |
| 7 | michelleyee | 13/05/2024 10:55 PM | michelleyee | 13/05/2024 10:55 PM | Africa | 4 |
Asia
| wdt_ID | wdt_created_by | wdt_created_at | wdt_last_edited_by | wdt_last_edited_at | Asia | Percentage |
|---|---|---|---|---|---|---|
| 1 | michelleyee | 13/05/2024 10:56 PM | michelleyee | 13/05/2024 10:56 PM | China | 11 |
| 2 | michelleyee | 13/05/2024 10:56 PM | michelleyee | 13/05/2024 10:56 PM | Asia/Australia/New Zealand | 10 |
| 3 | michelleyee | 13/05/2024 10:56 PM | michelleyee | 13/05/2024 10:56 PM | India | 5 |
Regional Projected Growth
| wdt_ID | wdt_created_by | wdt_created_at | wdt_last_edited_by | wdt_last_edited_at | Region | Percentage |
|---|---|---|---|---|---|---|
| 1 | michelleyee | 13/05/2024 10:58 PM | michelleyee | 13/05/2024 10:58 PM | U.S. | 96 |
| 2 | michelleyee | 13/05/2024 10:58 PM | michelleyee | 13/05/2024 10:58 PM | International | 58 |
| 3 | michelleyee | 13/05/2024 10:58 PM | michelleyee | 13/05/2024 10:58 PM | Asia | 15 |
Methodology
The Interior Design Giants annual business survey comprises the largest firms ranked by interior design fees for the 12-month period ending December 31, 2023. The listings are generated from only those surveyed. To be recognized as a top 100, Rising, Healthcare, Hospitality, or Sustainability Giant, you must meet the following criteria: Have at least one office location in North America, and generate at least 25% of your interior design fee income in North America. Firms that do not meet the criteria are ranked on our International Giants list. Interior design fees include those attributed to:
1. All aspects of a firm’s interior design practice, from strategic planning and programming to design and project management.
2. Fees paid to a firm for work performed by employees and independent contractors who are “full-time staff equivalent.”
Interior design fees do not include revenues paid to a firm and remitted to subcontractors who are not considered full-time staff equivalent. For example, certain firms attract work that is subcontracted to a local firm. The originating firm may collect all the fees and retain a management or generation fee, paying the remainder to the performing firm. The amounts paid to the latter are not included in fees of the collecting firm when determining its ranking. Ties are broken by rank from last year. Where applicable, all percentages are based on responding Giants, not their total number.
All research conducted by ThinkLab, the research division of SANDOW Design Group.
read more
Research
Introducing Interior Design’s 2023 Hospitality Giants
Interior Design’s 2023 Hospitality Giants demonstrate that the industry is bouncing back. Get the inside scoop on the sector’s comeback story.
DesignWire
Giants and Rising Talent Attendees Explore How Science Shapes Design
What type of environment optimizes cognitive function? A neuroscientist explores this question and more during Interior Design’s Giants and Rising Talent event.
Projects
Standout Projects by 2023 Hospitality Giants Reflect Their Locales
These projects by 2023 Hospitality Giants showcase spaces rooted in their communities, including hotels, restaurants, and everything in between.


recent stories
Research
Interior Design Spotlights 2024 Healthcare Giants
Healthcare maintained its edge over hospitality as second-largest sector for Interior Design’s Giants, and continued to experience solid growth in 2023.
Research
Introducing Interior Design’s 2024 Rising Giants
Interior Design’s 2024 Rising Giants are in and the numbers point to strong growth for the group, including a 9 percent increase in projects year over year.
Research
Presenting Interior Design’s 2024 Sustainability Giants
Learn how these environmentally focused firms are keeping the health of people and planet in mind with Interior Design’s 2024 Sustainability Giants.