Delegates are everywhere in modern code; a delegate is a type that represents references to methods with a particular parameter list and return type. Developers use delegates to pass methods as arguments to other methods. One example you may be familiar with is with event handlers. Handlers are methods you can invoke through delegates. ...
Reflecting on the past year's journey, our team was on a mission to enhance debugging tools, ensuring they became more efficient and user-friendly. We dedicated our efforts to boosting inner-loop productivity, making external source debugging more seamless, improving overall performance, and optimizing memory analysis. And, of course, we were ...
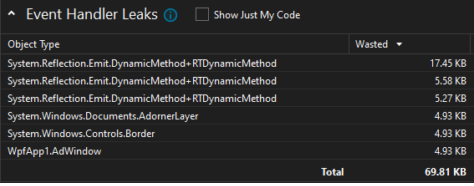
Event handler leaks have been around for a long time, and they are one of the peskiest issues WPF (Windows Presentation Foundation) developers regularly deal with. You might be thinking: What makes event handler leaks so important? Event handler leaks are easy to cause, all it takes is to forget to unsubscribe to an event. Additionally, they ...
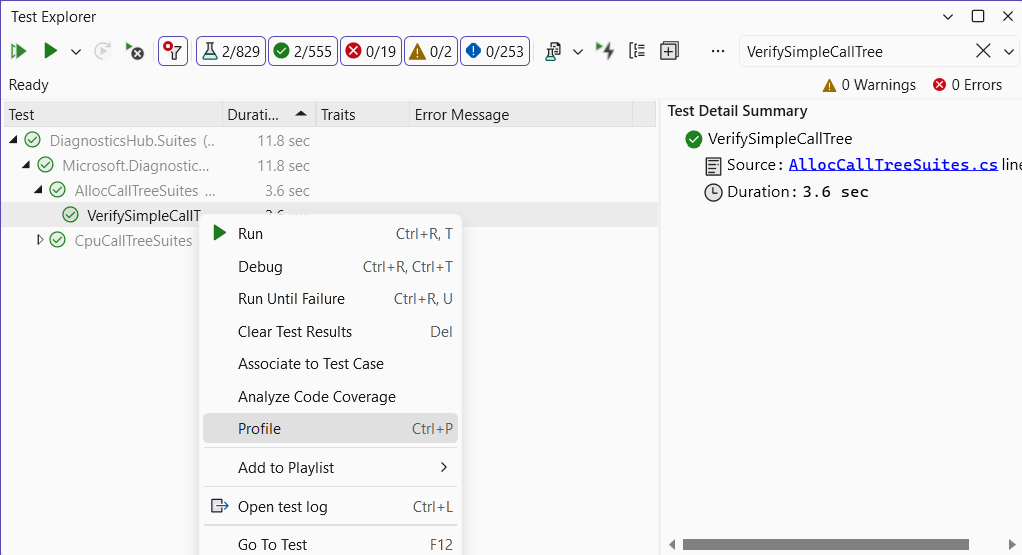
In Visual Studio 17.8 Preview 2 we have updated unit test profiling, allowing you to use any of the available tools in the performance profiler – not just the instrumentation tool. With this change, it’s easy to quickly profile small units of work in isolation, make changes, and then remeasure and validate the impact of the change. ...
Visual Studio has been supporting external sources debugging and decompilation for some time now. However, with the release of Visual Studio 17.7, the debugger took a significant leap forward by introducing Auto-decompilation for .NET libraries making the external code debugging in Visual Studio much more streamlined and effortless. Its ...
In Visual Studio 2022 17.6 and 17.7 we added a ton of new features in Parallel Stack Window that can take your multithreaded debugging to the next level.
But what can the Parallel Stack Window do for you? The answer is simple - it offers valuable insights into how your code functions in multithreaded or parallel or async environments. ...
Summary
With the release of Visual Studio 2022 version 17.6 we are shipping our new and improved Instrumentation Tool in the Performance Profiler. Unlike the CPU Usage tool, the Instrumentation tool gives exact timing and call counts which can be super useful in spotting blocked time and average function time. To show off the tool let’s use...
The Visual Studio Toolbox show helps you become a more productive developer by focusing on tooling in and out of Visual Studio. Our latest episodes of VS Toolbox (available both on Learn and YouTube) feature Mark Downie and Ramkumar Ramesh from the Visual Studio Diagnostics team. They demonstrate how you can use the Threads and Tasks views ...
Have you ever had a situation when you are debugging a complex scenario with a huge list of breakpoints, and you find yourself scrolling and tapping in the breakpoints windows to disable/enable them individually and repetitively?
Then the new Breakpoint Groups feature in Visual Studio may be the answer for you. This feature will allow you ...
Preview 2 for Visual Studio 17.6 is now available! If you are a game developer, a mobile developer, or are interested in learning new tricks to better debug your code, check out this latest release. It’s as easy as upgrading your Preview channel in the Visual Studio installer.
And if you haven’t activated your Preview channel for Visual...